|
http://sites.schaltungen.at/arduino-uno-r3/home/serial-plotter-ab-ide-1-6-6
Wels, am 2015-12-24BITTE nützen Sie doch rechts OBEN das Suchfeld [ ] [ Diese Site durchsuchen]DIN A3 oder DIN A4 quer ausdrucken ********************************************************************************** DIN A4 ausdrucken ********************************************************* ~015_b_PrennIng-a_arduino.uno.r3-home-serial.plotter.ab.ide.1.6.6 (xx Seiten)_1a.pdf
Untergeordnete Seiten (10):
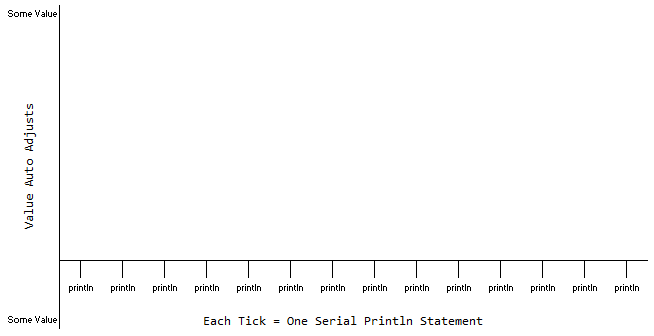
Single-Board-ComputerWith the release of Arduino IDE v1.6.6, a new tool was given to the users called the Serial Plotter. The idea of it is to be able to visualize the data you return, beyond just seeing numbers spit out onto the serial monitor. I’m a big fan of anything that lets people conceptualize the data their receiving in intuitive ways, so having a convenient graph generator in your IDE should be great. What The Arduino Serial Plotter IsThe Arduino Serial Plotter is, as the name suggests, a software utility within the IDE that takes incoming serial values over the USB connection. Instead of just displaying the raw values to a TTY monitor, it graphs them against an X/Y axis. The vertical Y axis auto adjusts as the value of your output increases or decreases, and the X axis is a fixed 500 point axis with each tick of the axis equal to an executed serial println command. Mit der Veröffentlichung von ARDUINO IDE V1.6.6 wurde ein neues Werkzeug gegeben, um die Benutzer namens Serielle Plotter. Die Idee ist es in der Lage sein, um die Daten, die Sie zurück zu visualisieren, als nur sehen Nummern heraus auf den seriellen Monitor spucken können. Ich bin ein großer Fan von allem, was die Menschen zu konzipieren die Daten ihrer Empfangs in intuitive Weise, also mit eine bequeme graphische Generator in Ihrem IDE sollte groß sein können. Was ist der Arduino Serien Plotter Das Arduino Serien Plotter ist, wie der Name schon sagt, ein Software-Dienstprogramm in der IDE, die ankommenden seriellen Werte über den USB-Anschluss erfolgt. Anstatt nur die Anzeige der Rohwerte an ein TTY-Monitor, sie Graphen es gegen ein X / Y-Achse. Die vertikale Y-Achse automatisch anpasst, wenn der Wert der Ausgabe erhöht oder verringert, und die X-Achse ist ein fester Punkt 500 Achse mit jedem Ticken der Achse gleich einer ausgeführten Serial.println Befehl.
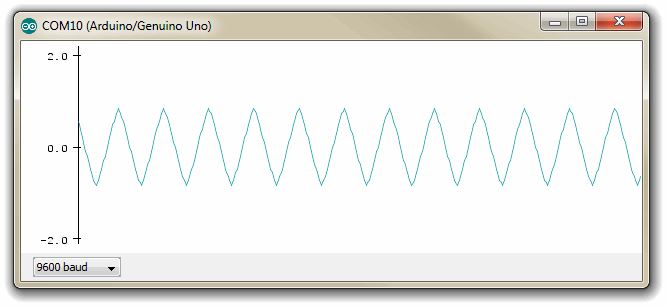
The plotter updates each time the serial line pops with a new value, which is to say, it updates slowly. Well, slow from a microprocessor standpoint. Testing the Serial Plotter We’ll start off by copying the example sketch that was displayed in the promo graphic for the release of v1.6.6. Der Plotter Updates jedes Mal, wenn die serielle Schnittstelle erscheint mit einem neuen Wert, das heißt, aktualisiert es langsam. Nun, langsam von einem Mikroprozessor Standpunkt. Testen des seriellen Plotter Wir werden durch Kopieren der Skizze, die beispielsweise in der promo graphic for the release of v1.6.6 angezeigt wurde, beginnen. Sketch Simple Sine Wave #include "math.h" // This will allow us to run the "sin" function. void setup() { Serial.begin(9600); // Enable Serial Output while (!Serial); } void loop() { // Describe the upward swing of the sine wave for (double i = -1.0; i <= 1.0; i = i + 0.1) { Serial.println (sin(i)); delay(10); } // Describe the downward swing of the sine wave for (double i = 1.0; i >= -1.0; i = i - 0.1) { Serial.println (sin(i)); delay(10); } } Upload that sketch using v1.6.6 and then open the serial plotter by either clicking on Tools / Serial Plotter or pressing CTRL+SHIFT+L (on windows). After the plotter opens up, you’ll see the sine wave begin to be drawn between -1.0 and 1.0 and back again. The function used in the sketch describes 20 values on the way up to to 0.84 and 20 values on the way back down to -0.84… 40 points to be plotted per duty cycle. Laden Sie den Sketch mit V1.6.6 und öffnen Sie dann die Serien Plotter indem Sie entweder auf Werkzeug / Serial-Plotter oder die Tastenkombination STRG + SHIFT + L (Windows). Nach der Plotter eröffnet, werden Sie sehen, die Sinuswelle beginnen, zwischen -1,0 und +1,0 und wieder zurück. Die Funktion die im Sketch verwendet wird, beschreibt 20 Werte auf dem Weg bis zu 0,84 und 20 Werte auf dem Weg zurück nach -0,84 ... 40 Punkte, die pro Arbeitszyklus aufgetragen werden.
12,5 x40 = 500 WERTe
As soon as the plot hits the right edge of the window, it starts scrolling from right to left, and this is the first problem I have with it… there’s no way to stop it. There’s no “uncheck autoscroll” to buffer the values outside the display like there is in the serial monitor. If Serial.println(); keeps hammering away, your data scrolls off the left side of the graph without you able to do a thing about it. Serial Plotter X AxisThe X axis is a fixed axis with each value representing one output of the Serial.println(); function. There is no time scale to speak of, really.
Ok, there is a time scale I suppose, if you use the baud rate of the serial monitor that you’ve set, but measuring time by how many serial outputs you received is a pretty crude way to measure anything
Along with that limitation, is the fact that the displayed axis is fixed at 500 points. It doesn’t matter how large or small you make your window, it’s still 500 points. Period. Sort of like a shift registers, when data point 501 shows up, data point 1 is lost. And since there’s no way to stop the plot from scrolling, you’ll need to compensate for this in your code. To show what I mean, this sketch will generate a square wave from 100 to 50 to 100 to 50, and do it 5 times. Note that all the work happens in Setup as a crude way of ensuring it only executes once.
und dies ist das erste Problem, das ich mit ihm ... es gibt keine Möglichkeit, ihn zu stoppen. Es gibt kein "deaktivieren Sie Autoscroll", um die Werte außerhalb der Anzeigepuffer, als gäbe es in der seriellen Monitor. Wenn Serial.println (); hält hämmerte, Ihre Daten Schriftrollen aus der linken Seite des Diagramms, ohne dass Sie in der Lage, etwas dagegen zu tun. Serien Plotter X-Achse Die X-Achse ist eine feststehende Achse mit jedem Wert, der einen Ausgang des Serial.println (); Funktion. Es gibt keine Zeitskala zu sprechen, wirklich. Ok, es gibt eine Zeitskala, ich nehme an, wenn Sie die Baudrate der seriellen Monitor, den Sie festgelegt haben, aber die Messung der Zeit, wie viele serielle Ausgänge, die Sie erhalten ist eine ziemlich rohe Weise, alles zu messen Zusammen mit dieser Einschränkung ist, dass die angezeigte Achse bei 500 Punkten befestigt. Es ist egal, wie groß oder klein Ihr Fenster zu machen, es ist immer noch 500 Punkte / Periode. Art wie ein Schieberegister, wenn Datenpunkt 501 auftaucht, Datenpunkt 1 ist verloren. Und da gibt es keine Möglichkeit, die Handlung von Bildlauf zu beenden, müssen Sie dafür in Ihrem Code zu kompensieren. Um zu zeigen, was ich meine, wird diese Skizze eine Rechteckwelle von 100 auf 50 100 bis 50 einen, und tun es 5 mal. Beachten Sie, dass die ganze Arbeit geschieht im Setup als rohes Möglichkeit, sicherzustellen, führt er nur einmal.
void setup() { Serial.begin(9600); while (!Serial); for (int i = 0; i < 100; i++) { Serial.println (100); // Data Points 0 - 99 } for (int i = 0; i < 100; i++) { Serial.println (50); // Data Points 100 - 199 } for (int i = 0; i < 100; i++) { Serial.println (100); // Data Points 200 - 299 } for (int i = 0; i < 100; i++) { Serial.println (50); // Data Points 300 - 399 } for (int i = 0; i < 100; i++) { Serial.println (100); // Data Points 400 - 499 } } void loop() { } It doesn’t matter how the window is resized, the same 500 data points display regardless. Es spielt keine Rolle, wie das Fenster verkleinert, das gleiche 500 Datenpunkte Anzeige unabhängig. 
A particularly annoying issue that arises from having this fixed axis with no tick marks or indicating lines, is that you have no reference as to when something was measured. Look closely at the transition between 100 to 50. You can tell from the code that there is no middle value… no 75, no 94. But if you expand the graph…

Without knowing when the values were measured, it’s not really possible tell from the plot if the transition was sharp and digital, or if it was fuzzy and analog. Another problem is that the serial monitor and the serial plotter cannot be run simultaneously. It’s either one or the other. Ohne zu wissen, wenn die Werte gemessen wurden, nicht wirklich möglich ist es zu sagen vom Grundstück aus, wenn der Übergang war scharf und digital, oder wenn es unscharf und analog. Ein weiteres Problem ist, dass die serielle Überwachungsbusschaltung und den seriellen Plotter nicht gleichzeitig ausgeführt werden. Es ist entweder die eine oder andere.

Plotting Real World DataSo how can this be used in the real world? In the I2C and SPI Education Series, I cover using the ADC to measure audio input signals at various sample rates.
So by hooking up the I2C and SPI Education Shield to an audio source, and loading up some of that code again, I should be able to plot the values using the serial plotter, instead of having to copy them out of the serial monitor and into Excel as I did when I wrote those tutorials back in April. In a moment of glorious serendipity, it turns out the final code I wrote for measuring a 660Hz signal grabbed 500 data points by default, so we should be able to graph this without any overflow or scrolling.
I encourage you to go check out those links above to understand exactly how everything was setup, but essentially it’s a 660Hz signal source, connected through a very simple biasing circuit to allow the Arduino to measure the signal in a 0-5V range instead of chopping off all signal below 0V.
Of note, this is the code that records the 500 samples first, then sends the output to the serial lines, rather than chopping up the sampling rate with a bunch of clunky and slow Serial.println(); commands. It also makes use of PORT commands instead of digitalWrite(); to generate as many samples as fast as possible. The end result, is actually pretty cool. Connect the Education Shield (or the MCP3008 Breakout Board) as described in those tutorials linked above to the signal source, upload this sketch and open the serial plotter. Plotten realen Daten Wie kann diese in der realen Welt verwendet werden? Im I2C and SPI Education Series, I Abdeckung mit den ADC, um Audio-Eingangssignale bei verschiedenen Abtastraten messen.
So durch Anschließen des I2C und SPI Erziehungsschild an eine Audioquelle, und Beladung bis einige dieser Code erneut, sollte ich in der Lage, die Werte über die serielle Plotter zeichnen sein, anstatt sie aus dem seriellen Monitor und in Kopie Excel wie ich, als ich schrieb, diese Tutorials im April. In einem Moment der glorreichen serendipity, stellt sich heraus, der endgültige Code I zur Messung eines 660Hz Signals schrieb packte 500 Datenpunkte standardmäßig, also sollten wir in der Lage, dies ohne Überlauf oder Scrollen Graph. Ich ermutige Sie, gehen Sie bitte zuerst diese Links oben, genau zu verstehen, wie alles eingerichtet wurde, aber im Wesentlichen ist es ein 660Hz-Signalquelle, durch eine sehr einfache Vorspannungsschaltung verbunden ist, damit der Arduino, um das Signal in einem 0-5V Bereich zu messen, anstatt Hack Aus allen Signal unter 0V. Zu beachten ist, ist dies der Code, der die 500 Proben ersten Aufzeichnungen, sendet dann die Ausgabe an die serielle Leitungen, anstatt Zerkleinern der Abtastrate mit einem Bündel von klobig und langsam Serial.println (); Befehle. Es macht auch Gebrauch von PORT Befehlen anstelle des digital (); viele Proben so schnell wie möglich zu erzeugen. Das Endergebnis ist eigentlich ziemlich cool. Schließen Sie das Erziehungsschild (oder der MCP3008 Breakout Board), wie in diesen Tutorials oben mit der Signalquelle verbunden beschrieben, laden Sie diese Skizze und öffnen Sie die seriellen Plotter. Sketch Sample Audio Signals with MCP3008
/*
A sketch to control the 10-Bit, 8-channel ADC MCP3008 on the Rheingold Heavy
I2C and SPI Education Shield at speeds necessary to sample an audio frequency signal.
This code specifically uses PORT commands to toggle the ADC chip select pin, instead
of using digitalWrite();
The code supposes the use of the Education Shield, but if you're using a breakout
board, connect the CS pin to Digital 4, and the SPI pins in their usual locations.
Website: http://www.rheingoldheavy.com/mcp3008-tutorial-05-sampling-audio-frequency-signals-02
Datasheet: http://ww1.microchip.com/downloads/en/DeviceDoc/21295d.pdf
*/
#include <SPI.h> // Include the SPI library
SPISettings MCP3008(2000000, MSBFIRST, SPI_MODE0);
const int CS_MCP3008 = 4; // ADC Chip Select
const byte adc_single_ch0 = (0x08); // ADC Channel 0
const byte adc_single_ch1 = (0x09); // ADC Channel 1
const byte adc_single_ch2 = (0x0A); // ADC Channel 2
const byte adc_single_ch3 = (0x0B); // ADC Channel 3
const byte adc_single_ch4 = (0x0C); // ADC Channel 4
const byte adc_single_ch5 = (0x0D); // ADC Channel 5
const byte adc_single_ch6 = (0x0E); // ADC Channel 6
const byte adc_single_ch7 = (0x0F); // ADC Channel 7
void setup()
{
SPI.begin ();
Serial.begin (9600);
pinMode (CS_MCP3008, OUTPUT);
digitalWrite (CS_MCP3008, LOW); // Cycle the ADC CS pin as per datasheet
digitalWrite (CS_MCP3008, HIGH);
delay(100);
int adc_reading[500];
SPI.beginTransaction (MCP3008);
for (int i = 0; i < 500; i++) {
adc_reading [i] = adc_single_channel_read (adc_single_ch7);
}
SPI.endTransaction ();
for (int i = 0; i < 500; i++) {
Serial.println (adc_reading[i]);
}
}
void loop()
{
}
int adc_single_channel_read(byte readAddress)
{
byte dataMSB = 0;
byte dataLSB = 0;
byte JUNK = 0x00;
//digitalWrite (CS_MCP3008, LOW);
PORTD = PORTD & 0xEF;
SPI.transfer (0x01); // Start Bit
dataMSB = SPI.transfer(readAddress << 4) & 0x03; // Send readAddress and receive MSB data, masked to two bits
dataLSB = SPI.transfer(JUNK); // Push junk data and get LSB byte return
PORTD = PORTD | 0x10;
//digitalWrite (CS_MCP3008, HIGH);
return dataMSB << 8 | dataLSB;
}
Because the sampling rate is significantly high, the output on the serial plotter looks appropriately gorgeous… Da die Abtastrate ist signifikant hoch, die Ausgabe auf der seriellen Plotter sieht entsprechend wunderschönen ... 
Unfortunately, because there’s no time scale listed, and no detail on the y-axis, you can’t really see into that signal to understand that it is a 660Hz representation. For all you know, it could be a 1Hz representation measured very slowly, since each tick represents not the sine wave, but a print command value. Serial Plotter Bottom LineWell, I think that it’s definitely a first version of what could eventually become a very useful utility. Using it right now requires a few items to be kept foremost when writing code to use the plotter.
Leider, denn es gibt keine Zeitskala, und kein Detail auf der y-Achse, kann man nicht wirklich in diesem Signal zu sehen, um zu verstehen, dass es ein 660Hz Darstellung. Für alles, was Sie wissen, könnte es sein, eine 1 Hz-Darstellung gemessen sehr langsam, da jeder Tick stellt nicht den Sinuswelle, sondern einen Drucksollwert. Serien Plotter Bottom Line Nun, ich denke, dass es auf jeden Fall eine erste Version von dem, was könnte schließlich ein sehr nützliches Programm zu werden. Verwenden Sie es jetzt erfordert ein paar Dinge, um in erster Linie gehalten, wenn das Schreiben von Code, um den Plotter zu verwenden. 1. Seltsamer veröffentlichten sie eine Funktion, sie dachte, war so cool, dass sie verwendet werden, sie in ihren Werbe-Blog-Meldungen, aber veröffentlicht Null Dokumentation dafür, dass ich finden kann. Es gibt nichts in der Amtssprache Referenz für bestimmte, und die Release Notes einzige Staat, dass es existiert. 2. Nur Ausgangszahlenwerte. Non-Zahlenwerte (z.B: Text) werden nicht angezeigt. 3. Denken Sie an die 500-Punkte-Grenze. Wenn nötig, bauen Unterstützung in Ihre Skizze, die Ihnen erlauben zu stoppen / unterbrechen die Ausführung, so dass Sie eine bestimmte Handlung zu einer bestimmten Zeit sehen werden. Die endgültige Weise zu tun, wäre mit einer Interrupt-Service-Routine. 4. Denken Sie daran, dass es keine Zeitskala, so dass die verstrichene Zeit zwischen Plot Point 98 und Plot Point 99 könnte 6.25ms oder es könnte 6,25 Tage sein. Es gibt keine Möglichkeit zu sagen. 5. Sie können die Serien Monitor nicht gleichzeitig öffnen, mit dem seriellen Plotter. Es ist die eine oder andere. Sie werden nicht in der Lage, sowohl offen zu halten, um den genauen Wert, der auf dem Plotter angezeigt zu lesen. 6. Seit der Plotter verwendet den USB-Seriell-Subsystem, bedeutet, dass Ihre Arduino wird jedes Mal, wenn es zu öffnen zurückgesetzt. Quelle: https://rheingoldheavy.com/new-arduino-serial-plotter/ DIN A4 ausdrucken ********************************************************* Impressum: Fritz Prenninger, Haidestr. 11A, A-4600 Wels, Ober-Österreich, mailto:[email protected] ENDE |
Startseite >